Vescore Global Market Outlook November 2022
Quantitative Investments
In breve
- Our risk model puts increased focus on phases prior to deep recessions
- Macroeconomic environment sends few positive signals
- Equity markets are pessimistic about market recovery
- Bond market prospects are negative in the short run
- The dollar rally could die down soon
Are we in the advanced stage of the bear market?
Although US inflation data for September was higher than expected, it prompted one of the most spectacular intraday rallies in US equity market history, as our data shows. Markets have performed well since October 12 thanks to increasing investor confidence that inflation has peaked, the end of the US cycle of interest rate hikes is drawing closer, and at least a mild recession is already priced into share prices.
An increasing willingness to consider fiscal policy stimulus in many countries also indicates persistent inflationary pressure on the supply side, which in the short term could be vital to the bond risk premium supported by investors. This impression is shared by our bond model regarding the negative contribution of the “mean reversion” and “momentum” components to bond allocation.
Bear market potentially not quite over yet
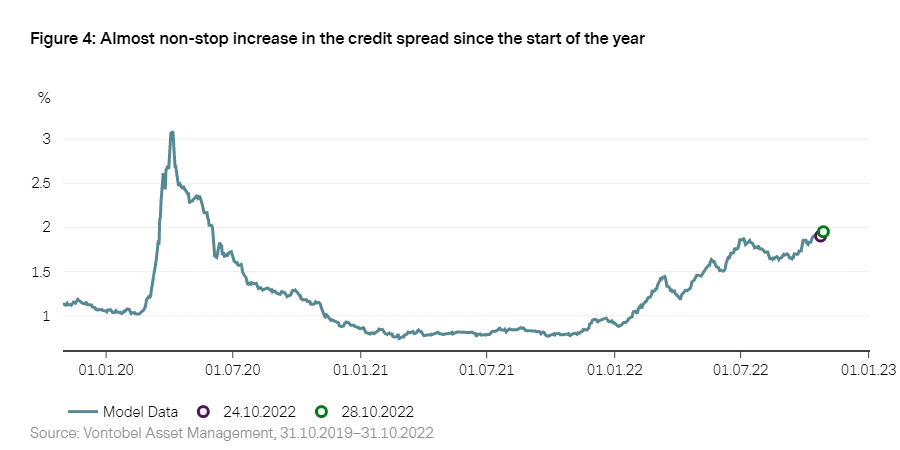
While hopes of more restrained Fed communication at the central bank meeting at the start of November seem premature, the risk of a recession or stagflation in the near future remains high. A glance at past rate hike cycles in the US since the Second World War shows that these types of aggressive interest rate rises have always culminated in a recession. This view is shared by Wave’s contraction signals. Our internal State-dependent Risk Measurement (SDRM) risk model, which we use to identify past clusters of volatility similar to the current market situation, also draws parallels with 1988 and 2007, both of which saw recessions take hold in the following year. Vescore’s equity market model is equally pessimistic about the immediate future, with the credit spread reaching levels seen in past recessions.
Nevertheless, from an investor perspective there is cause for hope. Looking back at the 26 bear markets experienced by the US equity market since 1929 shows that the average life expectancy of a bear market (280 days) was already reached in October, as data shows. Moreover, average equity performance in a bear market indicates that the bear market low is already two thirds over. Accordingly, the autumn could mark the last phase of the bear market.
Would you like to gain further exciting insights into our in-house business cycle model? Then register now for our monthly Wave Call.
Risk environment: Increased focus on phases prior to deep recessions remains
As in previous months, the risk environment is still strained. Our SDRM risk model , still places considerable weight on phases prior to crises or deep recessions.
Looking at this year’s trend, the market environment in 2007 increasingly shows parallels to the situation on markets today . At present, the 50 most similar days to today in the model are dominated by data from mid-August 2007. Back then, daily liquidity on US equity markets declined significantly, prompting record losses at some of the most successful equity hedge funds in the sector’s history (known as the 2007 quant meltdown).1
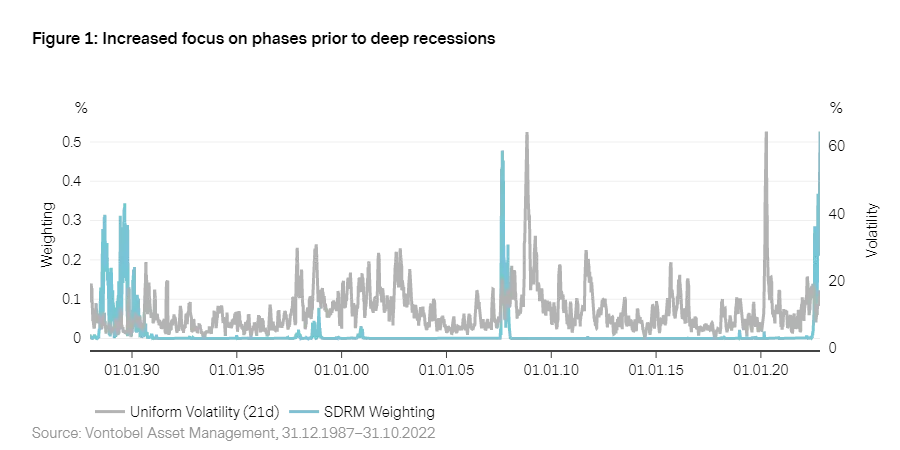
1998 (Asia and Russia crisis) and 1988 are also very similar to the current situation. The latter not only marked the clear beginning of the end for the Soviet Union, it can also be seen as the precursor to the crisis in 1989 and 1990.
Prices of options contracts, known as fed funds futures, indicate that market participants expect rates to peak at about 5% in the first half of 2023, before taking a breather until Q4 2023. This suggests that we may be on the brink of a new era of inflation, as the forces behind high inflation rates could remain for some time to come. New inflationary pressure is currently coming primarily in the form of a wage-price spiral, as employees attempt to make up for inflation-related losses by boosting their real income. As a result, central banks and their monetary policy will continue to determine the market environment in the future.
Uncertainty on financial markets thus remains high. In volatile and turbulent market phases, discussions often centers around the VIX Index, as it tends to correlate closely with the S&P 500: When the S&P 500 reaches new lows, the VIX often climbs to new highs. Last month, it reached up to 33 basis points, with the VIX currently at 26.
On the bond market, too, both bond prices and investor sentiment point to further interest rate hikes, with the MOVE Index continuing to fluctuate between 140 and 160 points and reaching its highest level since March 2020 last month. Liquidity on the market is dwindling, which increases market uncertainty and in turn results in higher implied volatility.
1. Khandani, A.E., Lo, A.W. (2011). What happened to the quants in August 2007? Evidence from factors and transactions data. Journal of Financial Markets, 14 (1), 1-46.
Macroeconomic environment: Few positive signals
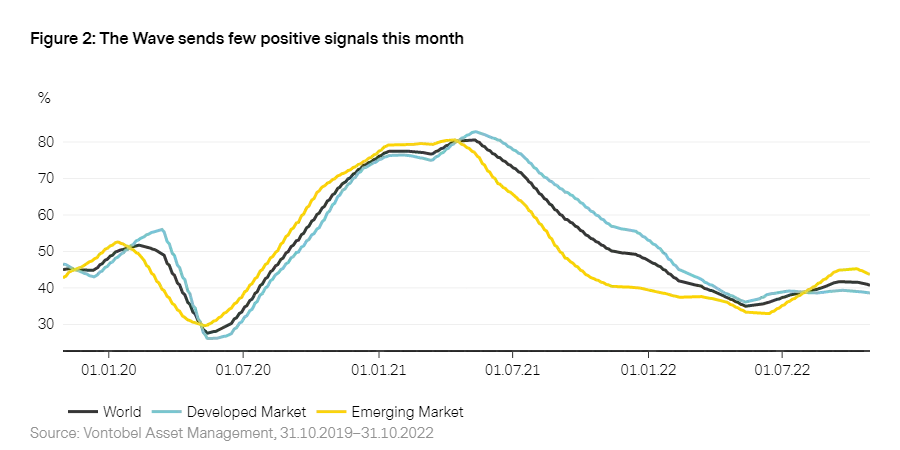
Our economic cycle model “ Wave2 ” is also sending negative signals for November. Wave assumes that both emerging markets and industrialized countries will remain in “contraction”, the most negative phase for risky asset classes. About half of the 50 countries we study are in “contraction”. Even though the “contraction signal” is broadly supported by a decline in all model components over the last few months, assets, the housing market, and economic sentiment are particularly key to the negative model result. Here, declining equity and real estate prices, higher refinancing costs, and weak consumer confidence are weighing heavily on future consumption.
“Full” impact of monetary policy on economy not seen until 2023
Although a warm October has significantly reduced the risks of an energy crisis in Europe, signs in a number of industrialized countries still point to “recession”. While both the eurozone and the US economy appear robust despite negative corporate and consumer sentiment, the pain – triggered by the change of monetary and fiscal policy direction, which will not make itself felt in the economy for 12-24 months – looks set to increase in the months ahead. The full impact of the aggressive interest rate hikes, balance sheet reductions and declining fiscal deficits will likely not be seen until next year. Accordingly, the solid labor markets in the US – 1.5 vacancies for every person looking for work – and in Europe should be taken as a “snapshot”.
China’s National Congress offers “little” hope for the Chinese economy
While the 20th National Congress of the Chinese Communist Party cemented Xi Jinping’s power, it did not set the course for strong economic recovery. It did not inspire hope about the ongoing real estate crisis or the dynamic zero-Covid strategy. China has eased monetary and fiscal policy in recent months, aiding the recovery seen in retail and industry since April. Nevertheless, this is half-hearted compared to past stimulus packages and only some of it is reaching the economy. This owes to the downturn on the Chinese real estate market, which takes a toll on banks’ risk appetite and lending. Down 46% year on year, new house building is coming close to historic lows.
2. For a detailed model description of our economic cycle model “Wave”, please see our white paper “
The Vescore Wave – a superior business-cycle model
”
Equities: Prospects of market recovery remain pessimistic
High inflation and rising interest rates are straining global growth. This can also be seen on equity markets, where uncertainty has picked up again in the last month. The VIX Index declined after the most recent US inflation figures were published but remains at a high level of 26 basis points.
Sustained cost pressure on companies, faltering demand and uncertainty about future economic conditions are reducing investor risk appetite. Given the still high inflation and interest rate hikes, combined with gloomy growth prospects, our equity model allocation is accordingly pessimistic.
The tactical equity weighting at present is -37,8%, 18% lower than in the previous month. The short contributions of the TED spread, the credit spread, and the dividend yield have increased in the last month. Only the term spread is still positive, although its contribution is far lower than in the last month.
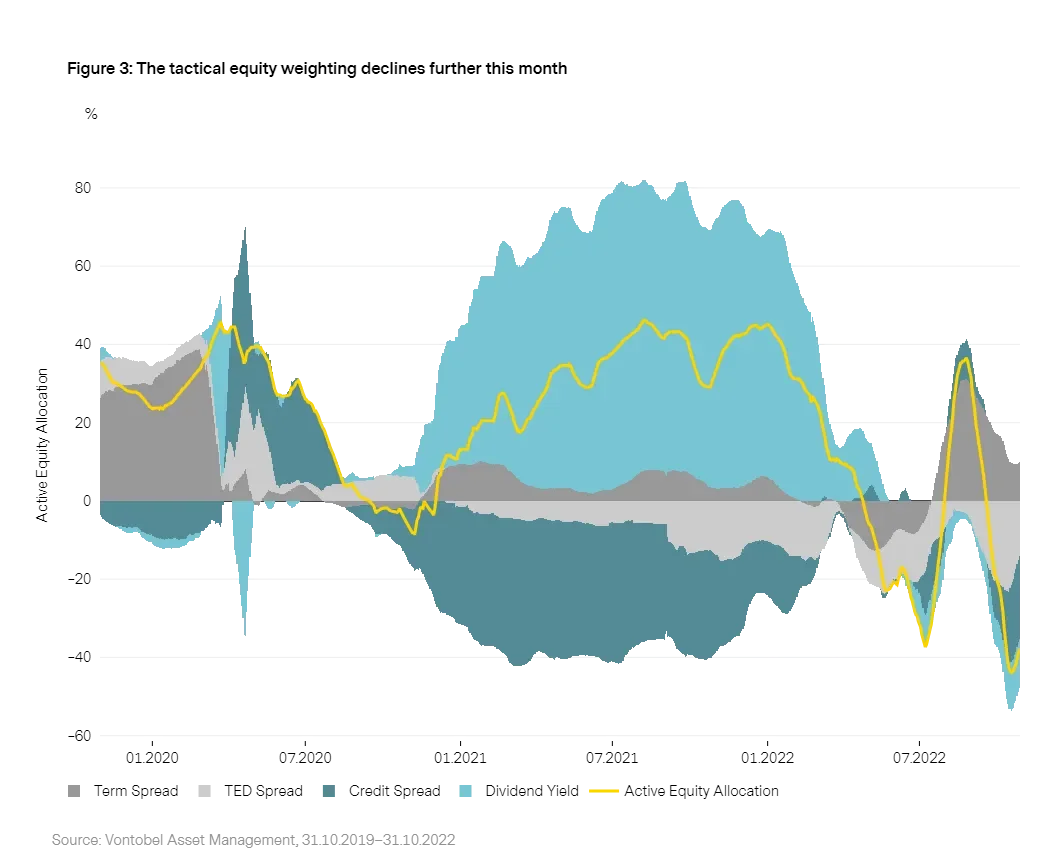
The clearest indication on the equity market that the economy is continuing to worsen is the almost constant rise in the credit spread, which measures market players’ confidence in companies’ solvency and their refinancing options, since the start of the year. At 1.95%, it has reached a level last seen during the pandemic in 2020, the euro crisis in 2012 and in spring 2008. Slower growth combined with further interest rate rises could further drive-up credit risks and cause the default risk to increase too. As well as sustained high inflation and rising energy prices, the increasingly gloomy economy and higher refinancing costs are a factor here.
Bonds: Negative prospects in the short term
This year’s bond market performance is disheartening for typical “diversified” investors, with higher inflation meaning that bonds tend to be more volatile and have a positive correlation with equities. The low-inflation era that dominated the last few decades had created an environment where negative bond yields were offset by positive yields on the equity market and vice versa. In response to the sharp increase in inflation and interest rate hikes by central banks, however, bond yields have risen and respectively bond prices have fallen.
Yet higher inflation also takes a toll on equities, as it produces higher nominal interest rates and thus higher discount factors. The greater correlation between bonds and equities that this creates has a negative impact on portfolio risk, as broad diversification is generated chiefly by securities that have a negative correlation.3
Another consequence of high inflation is that long-term equities are of no interest at the moment. Allocation for the momentum component4 of our model, which responds to market sentiment, is negative. This is not least because the latest US inflation figures have reinforced expectations that central banks will continue to raise rates until 2023. Allocation of the mean reversion component5 is also negative. Only the carry model6, which measures expected yields based on the current interest rate structure, has a slightly positive allocation.
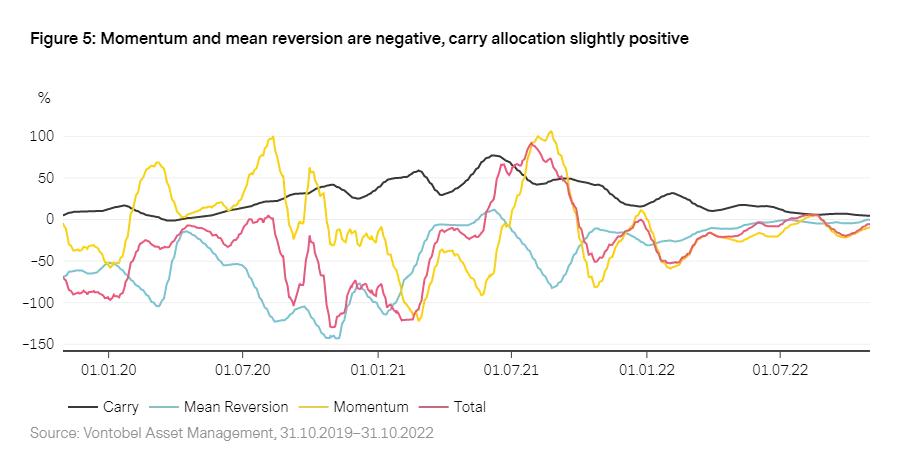
On a monthly basis, our bond model is still negatively allocated. However, estimated risk premiums for long-term (10 year) bonds show that higher inflation and inflation uncertainty will substantially increase risk premiums for long-term bond holding.
3. Markowitz, H. M. (1952). Portfolio Selection. Journal of Finance, 7, 77–91.
4. The momentum component takes account of the fact that yield curves could change very substantially and permanently in a short period of time as a result of major announcements by central banks and political decisions.
5. Mean reversion strategies are based on the idea that short-term interest rates signal convergence to a dynamic equilibrium.
6. Carry strategies generally assume no or only minor changes in the yield curve.
Current topic: Is the dollar rally in its advanced stage?
Our EUR/USD FX model, which is based on currency valuation and economic and trend factors, remains bullish on the dollar. It may come as a surprise here that our valuation model – which is based on purchasing power – does not currently consider the euro significantly undervalued, despite the fact that it has lost 14% against the dollar. This reflects the dollar’s purchasing power gain in connection with the massive increase in commodities prices7 and explains the appreciation of the USD compared to the EUR.
Dollar shored up by more robust economy
The lower competitive standing is also reflected in balance of payments statistics. While the eurozone current account, at -1% of GDP, has fallen by about 3 percentage points since the start of 2021, the US deficit over the same period is virtually unchanged at -5%. Two economic effects play a crucial role here. Firstly, the European export sector becomes more competitive when the dollar is strong. Secondly, imports measured in EUR are more expensive. Both of these effects should help improve the foreign trade balance. The problem is that the strong dollar was accompanied by a sharp rise in energy prices in 2022. Demand for raw materials such as oil and gas is relatively inelastic and covers almost all manufactured goods.
Rising inflation squeezes economy
This makes it hard for the European economy to respond to higher energy prices with lower demand. As a result, companies in Europe are forced – unless they have sufficient margins and market power – to pass these increased costs on to consumers. It is not difficult to see that this effect strains consumer spending and hurts the economy. Although the US is also affected by higher international energy prices, thanks to its own resources (e.g., shale gas) the impact of this is far lower than in Europe.
Monetary policy support drops off
While the economy and foreign trade are propping up the dollar, monetary policy support is beginning to slowly drop off. This is because the model estimates that we are approaching peak Fed “hawkishness”. Interest rate expectations may thus soon top out in the US, provided that inflation has also reached its highest level. In the eurozone, inflation could prove more persistent, in part due to the war in Ukraine, and therefore favor a narrowing of interest rate differentials. This is often an early sign that the dollar rally is fading.
7. The October 2022 edition of the GMO discussed the commodity price effect on the euro, dollar, and Swiss franc currency pairs.


