Yesterday we blogged on how European HY had always led recoveries in UK equities this century, and that even more so this time around we expect the same to happen.
We received a number of requests to see the same analysis for the US market, so here it is.
Chart 1: S&P500 vs US Liquid IG and US Liquid HY, daily returns from 31/12/99 to 23/03/20
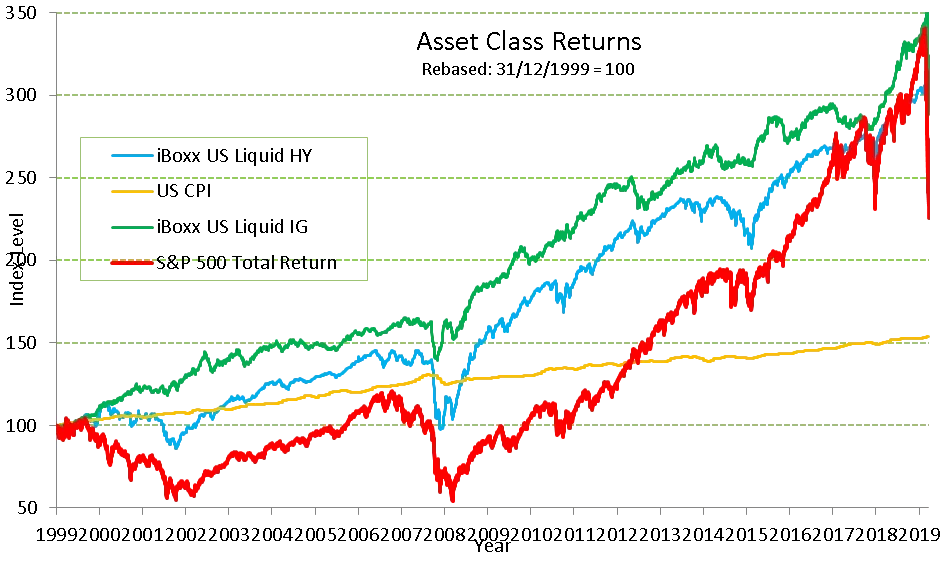
Source: TwentyFour, underlying data Bloomberg, iBoxx.
Let’s start with what is the same between the US and Europe before we move on to what is different:
HY has always led equities in crisis recovery, by several years
IG has always had a positive real return from January 1, 2000
HY has nearly always had a positive real return from January 1, 2000
Equities have had a negative real return for much of this century
Now let’s look at what is different.
Crisis #1 – The tech crunch
In the US, the drawdown in HY versus the S&P 500 was not nearly as correlated as we saw in the UK and Europe. In fact, US HY performed surprisingly well, capping downside risks to a much better degree than equities, while the S&P 500 still came close to an ultimate 50% drawdown until early 2003. In fact, US HY was about to produce a cumulative positive real return at about the same time as the US equity market troughed.
So in this regard US HY both lost less and turned around far more quickly than we saw in Europe. And in both cases of course HY returns were positive in absolute and real terms long before equities got back to either of those important outcomes. In fact, this time it took the S&P 500 six years to get investors back to par, but more than twelve years to give them a positive real return again. This was worse than we saw in Europe.
Crisis #2 – the global financial crisis
Again, this time the drawdowns in US HY were less than we saw in Europe, and thus the ultimate make-whole and positive real return story were also far quicker.
Again HY led equities with a lag of many years: those contractual high coupons gave investors returns far earlier in the cycle, especially when compared to discretionary dividends – in this case the lag was around four years.
Crisis #3 – a new coronavirus
This time, US HY has been nearly as correlated to equities on the way down (it is easier to see this on the below chart with a more transparent line for the S&P 500)

What should also be said here is that the S&P500 has come far closer to the cumulative returns of US IG and even eclipsed HY in the last few months – something we never saw in Europe. But one of the key contributory factors explaining this in the US has been the huge volume of share buybacks, a phenomenon which is not exclusively US-based, but has been dramatically tilted to the US stock market. Are buybacks likely to keep happening in an era of higher liquidity requirements and potential government support? We think not.
So ultimately we have exactly the same view on the US market as we gave yesterday for Europe. We expect HY to lead equities by several years through this crisis. Following the behaviour of banks in the last crisis instructs our view on non-financials right now, and it is worth restating that view here:
What the banks have had to do in the last 10 years is recapitalise. They have had to rebuild capital ratios to well in excess of what they were in 2007, typically three or four times what they were in fact. What this has meant for these institutions’ return on equity is obvious; higher capital and lower leverage ratios mean a far less stressed balance sheet and far less operational leverage, and thus returns to equity holders began to look less like growth stocks and more like utilities.
We expect something similar to now happen to non-financial corporates. They too will have to have higher liquidity buffers, less operational leverage and ultimately more utility-like cash flows to investors, with less growth upside available to pay out as dividends, share buybacks, or simply to inflate the market value of the equity. Any sectors with explicit bailouts or large equity ownerships from the state are also likely to be prohibited from equity distributions, just as the banks were.
The latest Federal Reserve announcement of essentially unlimited QE should also help the credit story versus equity. The Primary Market Corporate Credit Facility (PMCCF) and Secondary Market Corporate Credit Facility (SMCCF) will provide bridge financing to ensure contractual liabilities and obligations such as coupons and principal repayments are met in a timely manner. Dividends, being discretionary, will be completely different.
Ultimately, we believe credit will continue to outperform equity for many years to come. Contractual coupon and principal payments have consistently delivered above inflation returns across IG for the last 20 years, and across HY for most of that period, compared to less than half the time for equity. We see no reason why it should be different this time, and this is why we do not think equities are a buying opportunity when you can buy IG and HY credit at some of the cheapest yields we have ever seen, whereas any company taking government support over the short term is going to struggle to justify equity dividends or buybacks.
And to finish off, yesterday’s conclusion had so much positive ‘traction’ we have to repeat it once more (but adjusted for a US audience): in our view, investors should be hoarding credit just like they are hoarding toilet tissue.