The goal of income investing is to ensure that your portfolio generates a steady source of revenue regardless of market conditions.

Fixed Income 101: Roll-down
Roll-down is the capital gain created by the natural fall in a bond’s yield as it approaches maturity. As a fixed income investor, it is probably the most you will ever get paid for doing nothing.
It helps to start by considering the shape of a typical yield curve, which is simply the line you get if you plot the yield a bond issuer pays for borrowing at different maturities.
Yield curves are typically upward sloping, meaning the yield on shorter maturity bonds is lower than those on longer maturity bonds; investors take a bigger risk on longer dated bonds, so they demand a higher return.
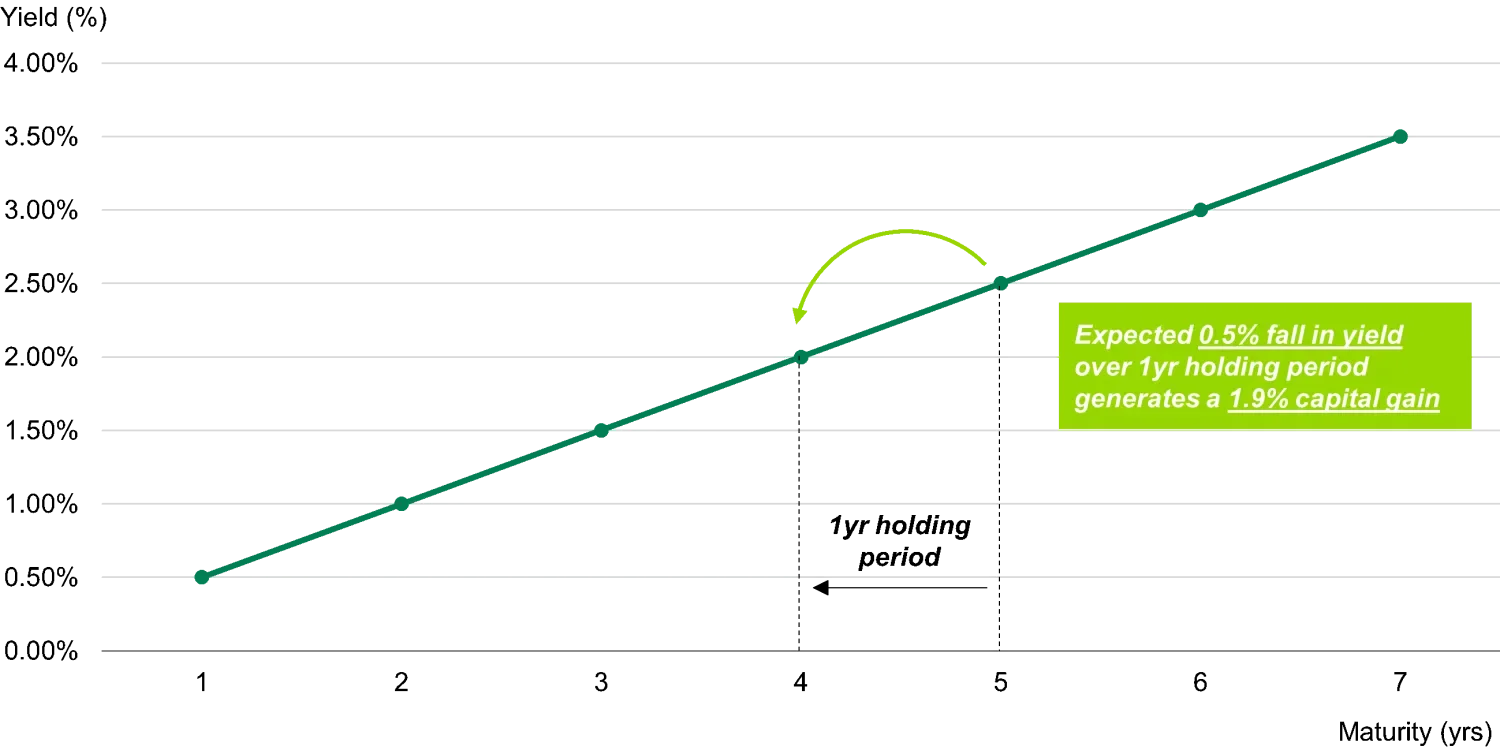
Graphic used for illustrative purposes only and is not based on a particular security
Assuming the shape of the yield curve doesn’t change dramatically, a bond held for one year will have a lower yield than it did a year ago. A lower yield means a higher price, which is a capital gain – that is your roll-down return.
As a basic example, let’s say you buy a five-year bond at par (a cash price of 100) with a yield of 2.5%. If you hold that bond for one year, you now effectively own a four-year bond, and all things being equal, based on the yield curve in the chart above, you can expect its yield to have dropped to 2%. Since yields move inversely with prices, the cash price of your bond has now risen to 101.90, a capital gain of 1.9%.
Fixed income fund managers think about roll-down in different ways, depending on their investment objectives.
One common roll-down strategy among retail investors, for example, is to buy longer dated bonds with the aim of earning higher yields. If the yield on five-year bonds doesn’t look particularly attractive, you might instead buy a 10-year bond and plan to hold it for five years, before selling and buying another 10-year bond; this strategy is often referred to as ‘rolling down the yield curve’. Your holding period is the same, but your income over the holding period is higher, and in theory when you sell your 10-year bond after five years you should also make a capital gain from the increased price.
However, the shape of a bond issuer’s yield curve – and this goes for both corporate and government bonds – is driven by many factors, and they are rarely (if ever) a straight line as in our basic example above.
In shorter maturities yields are primarily driven by the market’s short term interest rate expectations, while for longer maturities market inflation expectations become more influential. This means yield curves tend to be ‘steeper’ at the short end than they are at the long end.
The steeper the curve, the bigger your potential for roll-down gains, since the bond’s yield can be expected to fall further over a one-year holding period. However, we must remember that the shorter the bond, the lower its price sensitivity to changes in yield (this is duration). Position too short on the curve and the lack of duration means your roll-down gains are very small; position too long and you miss the steepest section. The ‘sweet spot’ for roll-down gains will vary between sectors and issuers, but in our experience it is often in the 3-4 year part of the curve.
For example, the chart below shows the yield curve of US telecoms giant AT&T as it was in May 2018.
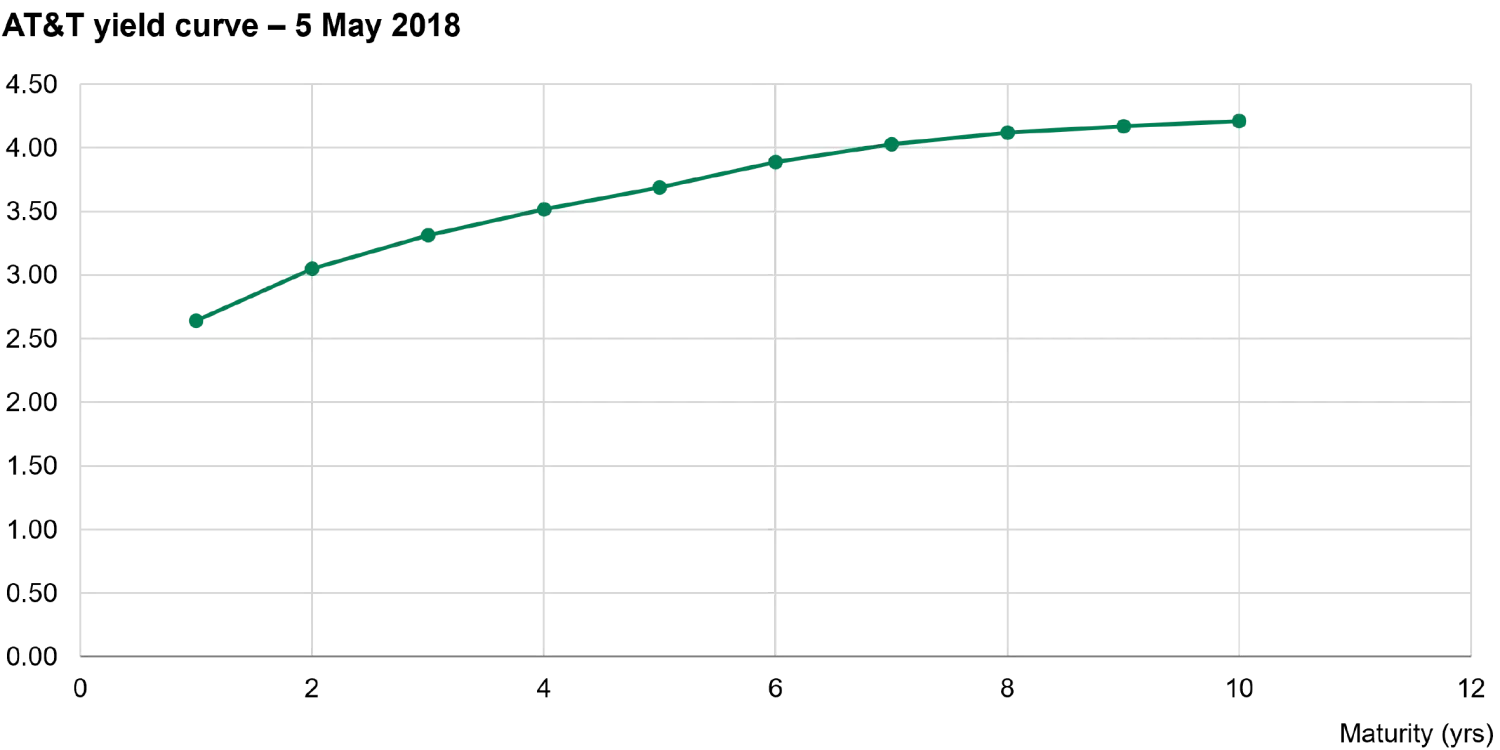
Source: TwentyFour, Bloomberg, 5 May 2018
At this point, you could have bought a four-year AT&T bond at a cash price of 100 and a yield of 3.52%. After holding it for one year, you would expect to now be holding a three-year bond that yields 3.31% at a cash price of 100.59 meaning a roll-down gain of 0.59%, which added to your yield makes your total return 4.11% over one year.
If instead you bought the 10-year AT&T bond yielding 4.21% at a cash price of 100, after one year your nine-year bond should now yield 4.17% at a cash price of 100.30, a roll-down gain of 0.30% and a one-year total return of 4.51%.
The higher total return on the 10-year option may look attractive, but many fund managers will consider the higher expected roll-down gain of the four-year bond to be better value, particularly since the 10-year bond comes with added duration and longer dated bonds tend to experience more volatility; in other words, the roll-down potential of the four-year bond is seen as more reliable.
It is also worth noting here that to realise a roll-down gain you do have to sell the bond at some point before maturity, because a bond’s cash price will trend back towards par the closer it gets to maturity.
When fund managers talk about the attractive roll-down available in some bonds, they aren’t necessarily intending to sell those bonds after a year to realise the gain. However, roll-down can be a useful tool in fixed income portfolio management as it can help investors identify where exactly they want to sit on the yield curve, and where they can expect to be best rewarded for taking that one year of risk.
Important Information: TwentyFour, its affiliates and the individuals associated therewith may (in various capacities) have positions or deal in securities (or related derivatives) identical or similar to those described herein. The companies identified above have been used for illustrative purposes only to help elaborate on the subject matter under discussion. They should not be deemed a recommendation to purchase, hold or sell the same or similar. No assumption should be made as to the profitability or performance of any company identified or security associated with them.

Fixed Income 101: Income investing

Fixed Income 101: Comparing yields in different currencies
Fixed income managers always want to have the flexibility to look for the best value across their investment universe, and in our view they therefore need the capacity to buy bonds in different currencies.

Fixed Income 101: Inflation-linked bonds
Inflation is widely understood to be bad for bonds. Fundamentally, this is because inflation erodes the value of the coupon and principal payments that fixed rate bondholders receive in the future.

Fixed Income 101: Trading ABS and CLOs
Bids Wanted in Competition (or BWIC) lists are a unique characteristic of the ABS and CLO markets, where they are widely used in secondary trading when investors are looking to sell bonds.

Fixed Income 101: Hedging currency risk
Hedging currency or foreign exchange (FX) risk is a key decision for any manager running a diversified fixed income portfolio. Currencies are inherently volatile, so whether and how FX risk is managed can have a material impact on a portfolio’s risk and return profile.