

Quantitative Investments
Your partner for leading quantitative investment solutions.

There should be little doubt that the Federal Reserve’s monetary policy stance influences market developments. But the fact that the Fed is willing to put its goal of tackling inflation above the well-being of its own economy is new – at least for those who did not live through the 1980s. In August, at the annual meeting of central banks in Jackson Hole, there was even talk of pain that the US economy might have to endure.
Our quantitative models had therefore concluded at the start of September that the pain tolerance level had already been reached and that a rethink of monetary policy was necessary. Accordingly, bad news was interpreted as good news. However, hopes that the “pain” was already as high as the Fed would tolerate were dashed at its monetary policy meeting in September. The US Federal Reserve intends to continue its cycle of interest rate hikes until the end of the year and then leave rates unchanged for a longer period of time. It did not once mention cutting back the balance sheet reduction. Markets responded in shock, with the lowest point of the current bear market from June broken in the days that followed. Equity markets are now at their lowest level since November 2020.
The reason for this change in central banks’ monetary policy stance is the reassessment of “inflation”. Since the financial market crisis, monetary policy has had an increase in inflation as its goal, i.e., it has viewed inflation as positive. Since this year, however, inflation has been viewed as negative. Central banks are thus now doing all they can do keep price increases in check. This evokes memories of the 1980s, which saw Paul Volcker spearhead unprecedented efforts to tackle inflation. Volcker also considered inflation harmful after a decade in which it was simply shrugged off. As a result, he launched aggressive monetary policy, pushing the US economy into a deep recession. The problem here is that this happened more than 40 years ago and, ever since, all business cycles have ended with lower inflation and interest rates. Bit by bit, this also made inflation less of an important variable in quantitative models.
Since mid-September, however, our models have noted the increasing possibility of the US economy stalling due to higher probabilities of default. In line with this, our business cycle model “Wave” also sees not only the U.S. but also the global economy slipping back into “contraction”. By contrast, our equity allocation model has significantly reduced the risks it accepts and accounts for the higher probabilities of default in the corporate sector (credit spread) and the banking sector (TED spread) due to the greater risks of recession. Moving on to bonds, while the substantial “mean reversion” potential indicates that bonds will be more attractive in the future, extremely negative momentum signals that yields could continue to rise in the short term and restricts bond duration. As our SDRM risk model indicates, market volatility will thus likely remain high, and the bear market is unlikely to have bottomed out.

Would you like to gain further exciting insights into our in-house business cycle model? Then register now for our monthly Wave Call.
In September, our inhouse risk model State-dependent Risk Measurement (SDRM) , which we use to identify historical volatility clusters that resemble the current market situation, increasingly weighted the phase before the 2008 financial crisis . Data from November and December 2007 particularly stand out in the 50 most similar days. This implies that the current financial market environment features similar market risks to the period identified in the historic financial market.
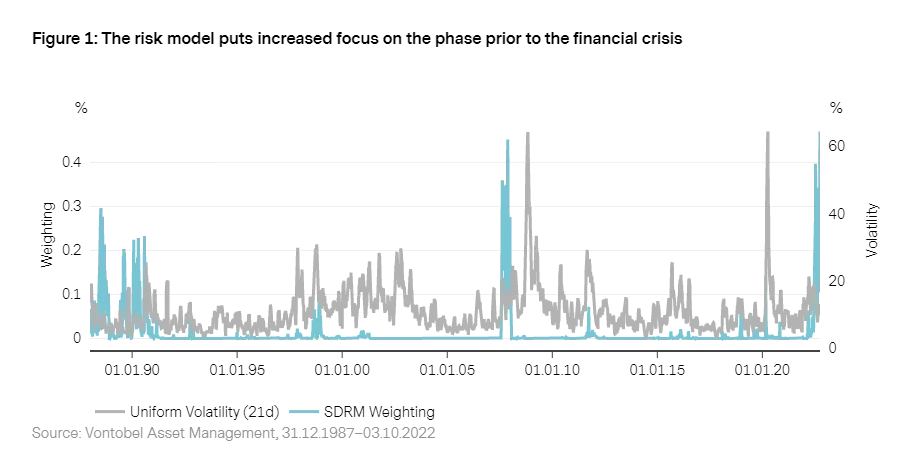
In addition to the late autumn and winter months of 2007, market phases before 1990 are also very similar to the current market environment. This year marked the beginning of an economic crisis in the US, which was characterized by difficulties in the international currency system, rising oil prices and inflation. At that time, the Fed raised interest rates, which, in the face of falling economic optimism and overvalued stock and real estate markets, resulted in a credit crisis and a long recession.
We believe that current market uncertainty is still coming primarily from the bond market. Here, in addition to the aforementioned historical volatility clusters, the period of the Russian and Asian crises in 1998 becomes more important. In the current environment, uncertainty on bond markets is being made worse primarily by restrictive central bank monetary policy and, in turn, interest rate movements. This is also reflected in the MOVE volatility index, which currently fluctuates in a range of 140 to 158 basis points.
After recovering briefly in August, uncertainty has also picked up again on equity markets. Equity volatility, as measured by the VIX, climbed from 19 to 32 basis points in September. This was prompted by inflation spillover effects and higher interest on investment returns, as well as the contractionary effects these have on the economy as a whole.
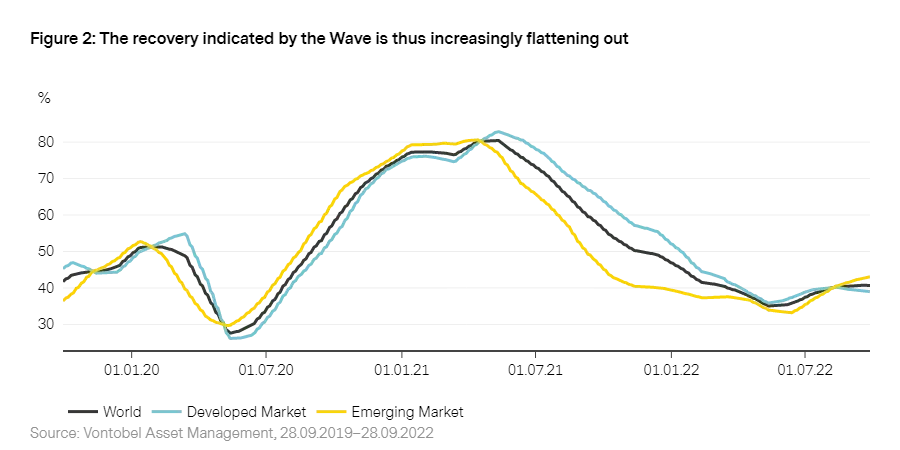
As expected, the global economic outlook has continued to deteriorate. The global Wave has been signaling an economic recovery since the end of June, a result of improving global supply shortages and the easing of Covid restrictions. At the same time, however, a growing number of countries are slipping into “contraction”. 52% of the 50 economies we examine are now back in “contraction”. The recovery indicated by the Wave is thus increasingly flattening out.
Fed’s most aggressive cycle of interest rate hikes since the 1980s is particularly hurting consumer confidence. The still extremely sound US labor market ¬ there are currently twice as many vacancies as people looking for work ¬ and the only slow decline in inflation are reminiscent of Paul Volcker, whose aggressive interest rate increases stifled inflation through a recession at the start of the 1980s. This comparison is enhanced by the approach taken by the current Fed Chairman Jerome Powell, who warned of “pain for the economy” at the annual central bank meeting in Jackson Hole.
The eurozone is suffering even greater pain at present: its high energy dependency on Russia, rising yields and the risks this entails in connection with peripheral countries’ debt sustainability are hurting both company investment and private consumer spending. Households and companies alike are also being disproportionately hit by skyrocketing energy costs. Given this, it is not surprising that the decline in the Wave and, in turn, economies in industrialized countries is due almost entirely to Europe.
By contrast, Asian countries far away from the energy crisis (Japan, Australia, New Zealand and Asian emerging markets) are enjoying far better economic momentum. In China, in particular, signs point to recovery. This is due to Beijing's efforts to combat the real estate crisis with the help of monetary and fiscal policy expansion. A positive side effect is rising retail sales, industrial production and investment. However, the still smoldering real estate crisis currently makes the Chinese recovery look faint.
The market environment for global equities is highly uncertain. Throughout September, our equity allocation model reduced the tactical equity weighting from 35.7% in the previous month to -19.4%. The negative equity allocation is driven primarily by central banks’ aggressive interest rate hikes, resulting in more pessimistic prospects in recent weeks.
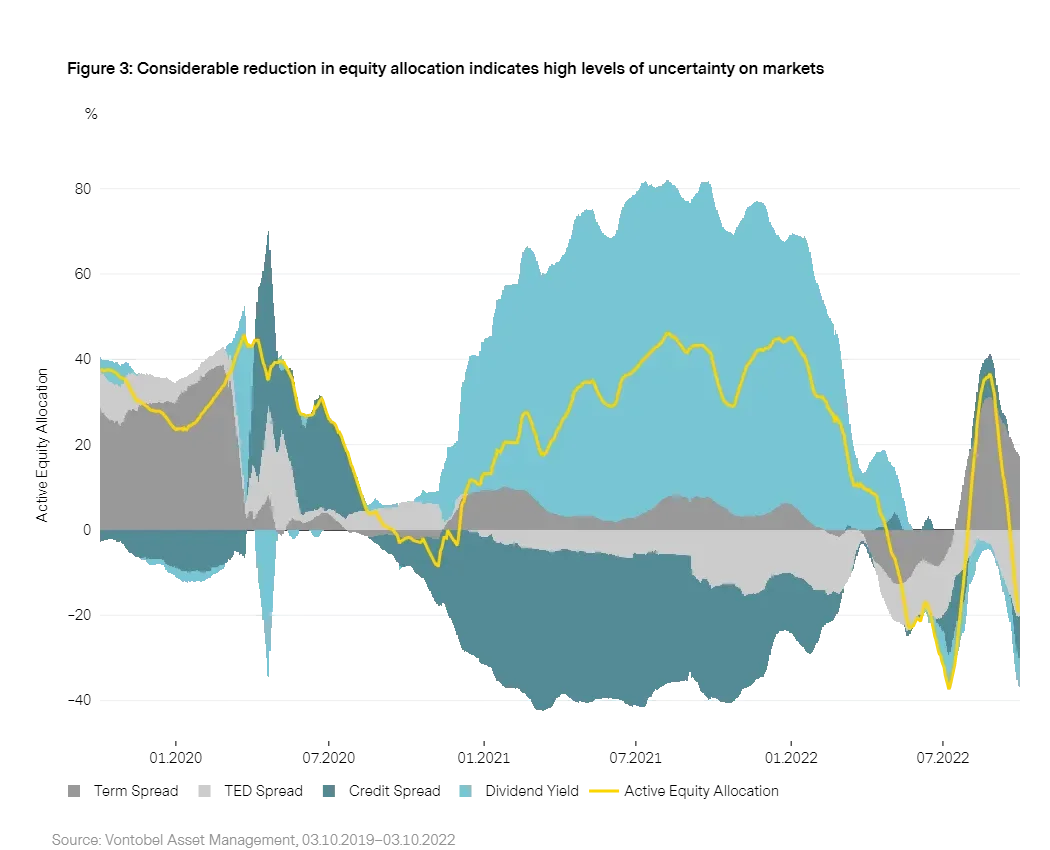
Even the credit spread, which measures market participants’ trust in companies’ solvency and their refinancing options, picked up again after briefly declining last month. These increasing risk premia are the result of the direct impact of the worsening economy.
The bond market is still showing no signs of easing with regard to inflation and any further interest rate hikes that may result from this. This is also reflected in volatility, as measured by the MOVE Index, which is still at a high level and has increased further over the last month. Our bond allocation management model has reduced bond duration significantly in the last month. It is currently -0.5 years.
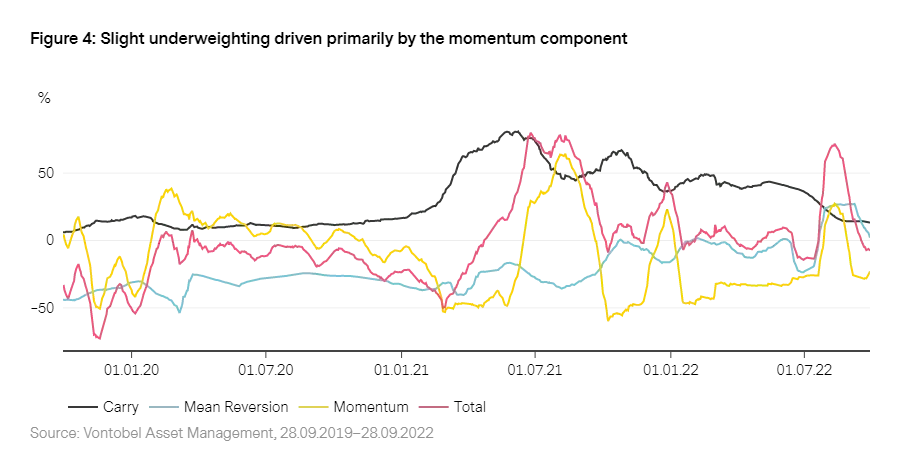
The Fed’s restrictive approach to tackling stubborn inflation can be seen in its aggressive monetary policy. As a result, the short end of the yield curve is increasing more sharply than the long end, making the yield curve flatter and further reducing the term spread. Both are indicators of weak economic performance. The carry component1 of our model, which we use to forecast future changes in the yield curve, is also declining as a result.
The long end of the yield curve is currently in line with the historical average. This indicates that the short end should move down for the yield curve to return to its dynamic equilibrium. Accordingly, the mean reversion component2 of the model switched to long this month. This means that the model expects more attractive yields at the front end of the yield curve.
On the other hand, the momentum component3, which responds to market sentiment, rates bonds negatively at present. This is primarily due to expected interest rate hikes. The market currently thinks the chances are dwindling that central banks will abandon their series of rate hikes in the first two quarters of 2023. In light of this, the momentum short position increased accordingly in September. Regarding different country allocations, allocation for all countries except Italy is short at present.
1. Carry strategies generally assume no or only minor changes in the yield curve.
2. Mean reversion strategies are based on the idea that short-term interest rates signal convergence to a dynamic equilibrium.
3. The momentum component takes account of the fact that yield curves could change very substantially and permanently in a short period of time as a result of major announcements by central banks and political decisions.
As a currency analyst at the time, I still remember January 15, 2015, well. It was the day the SNB scrapped the minimum exchange rate of CHF 1.20 per euro. As the franc exchange rate plummeted to below parity within minutes, I was not the only one sitting astounded in a meeting; there was a loud outcry throughout the entire economy.
Now, about seven years later, the CHF exchange rate is back where it was when it temporarily dropped in 2015: at CHF 0.95 to the euro. Unlike back then, however, no shock waves have rippled through the economy. This observation is also reflected in the KOF business survey4. But why have players come to a different conclusion about the state of the economy this time and what are the arguments for the weak euro?
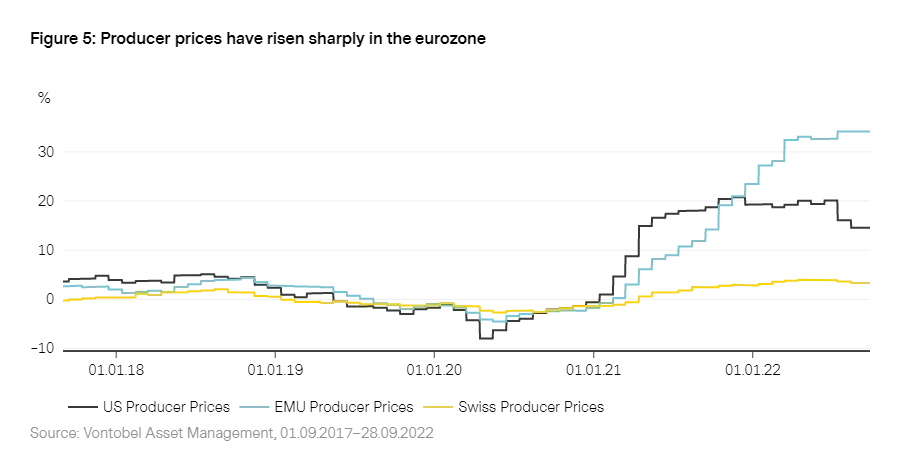
Sharp rise in eurozone producer prices
To answer this question, I have turned to data from our exchange rate model. This includes three different components, one of which is the assessment5. The assessment uses a range of indicators to measure how competitive economies are. One of these indicators is producer prices, which primarily comprise tradeable goods and that are suitable for calculating changes in competitive standing by international standards.
Since the start of the war in Ukraine, soaring producer prices – which are particularly good at anticipating the impact of this macroeconomic shock – have been indicating a decline in Europe’s competitive advantage. This loss is far higher in the eurozone than in other regions or countries. But why?
Euro depreciation makes up for lower competitive standing
On the one hand, Europe is more affected by the supply shortage of Russian gas than the USA and Switzerland. This is due to the fact that Switzerland has a better energy mix, and the USA is no longer a net importer of oil. On the other hand, the share of manufacturing and the export dependency in the Eurozone is higher than in the aforementioned countries, which implies a higher final consumption of the economy. Taking into account the cost effect, our model concludes that the euro is currently fairly priced against the dollar and still overvalued compared to the franc.
Economic momentum in the eurozone could continue to slow
While the currency valuation gradually indicates favorable entry levels, cyclical factors still advise restraint. Further energy shortages and a cold winter, in particular, could further slow the eurozone’s already weak economic momentum and further strain the trade balance, which is in deficit for the first time since 2012. Nevertheless, uncertainty – including further aggressive interest rate hikes by the Fed – could top out in the months ahead and significantly improve the model outlook for the euro.
4. See
https://kof.ethz.ch/en/surveys/business-tendency-surveys.html
5. As well as the assessment, other components included in the model include technical (trend) and cyclical factors (Wave, foreign trade and relative monetary policy).
