Multi Asset Boutique
Fundamental strategies to protect and grow investors’ assets in their chosen markets.

One of the deepest global recessions of all time has been one of the shortest as well, lasting only two months in the US, for example. Thanks to central bank and government action, the subsequent economic recovery was just as spectacular, as was the rally in cyclical asset classes with global equities almost doubling in value since April 2020. The rapid change of the economic environment can be confusing, and the better investors are able to track the development of business cycles and draw conclusions for their positioning, the better for them.
Discussions by the office water cooler now often revolve around peak growth or peak inflation and their implications. But we feel that the topic so far hasn’t received the attention it deserves, probably because huge base effects are producing astonishingly strong growth data, which is distorting the real picture. To get a clearer idea about our views on the “real” state of the economy, we refer to our proprietary business cycle model “Wave” .1
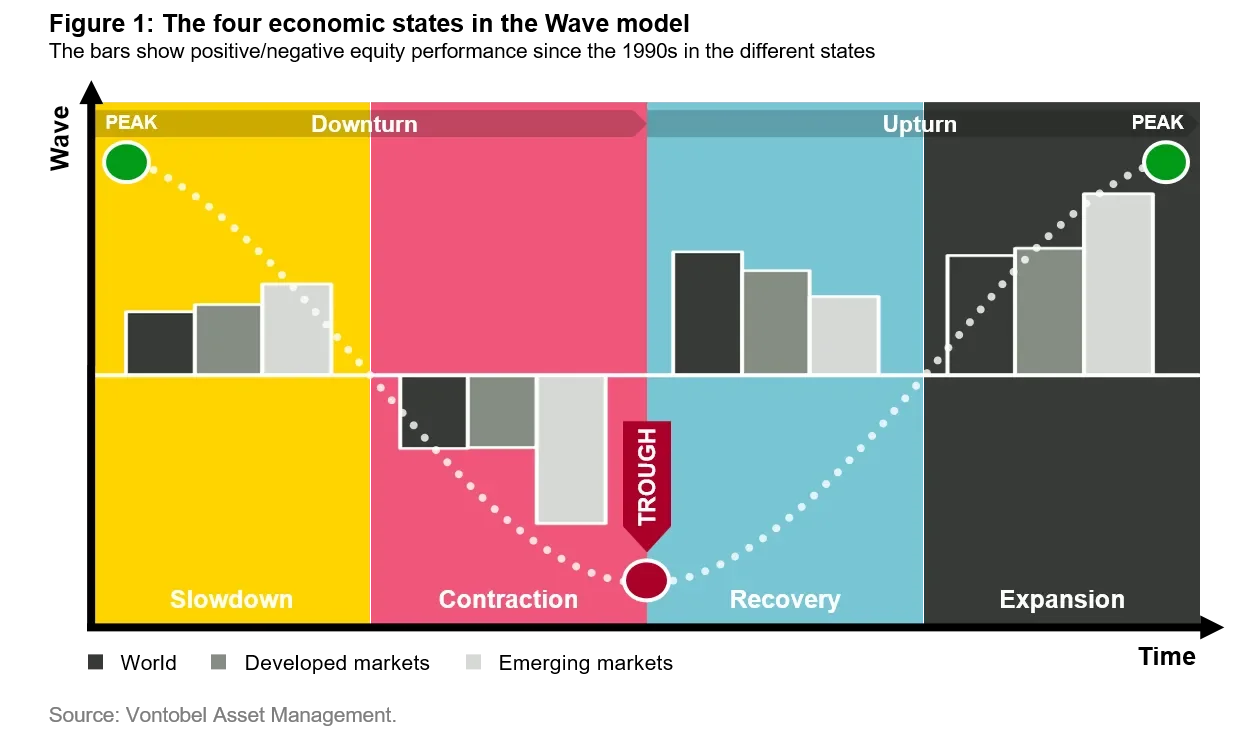
The Wave model uses a big-data approach to indicate which of the four states of business cycles – slowdown, contraction, recovery, or expansion (see figure 1) – we’re in. On the highest aggregation – the global Wave – we currently process more than 1,000 economic data time series for 50 countries, dating back to the 1990s where available. Two factors differentiate the four states: The share of above-trend economic indicators and the trend of this indicator itself. A slowdown, for example, is defined as the state in which more than half of the processed indicators are above their respective trends while the percentage is diminishing – a sign of the economy losing momentum. Investors with a tool enabling them to see the moves and anticipate changes in the business cycle should be well-positioned to shield their portfolios from heavy losses when equity markets tumble, for instance.
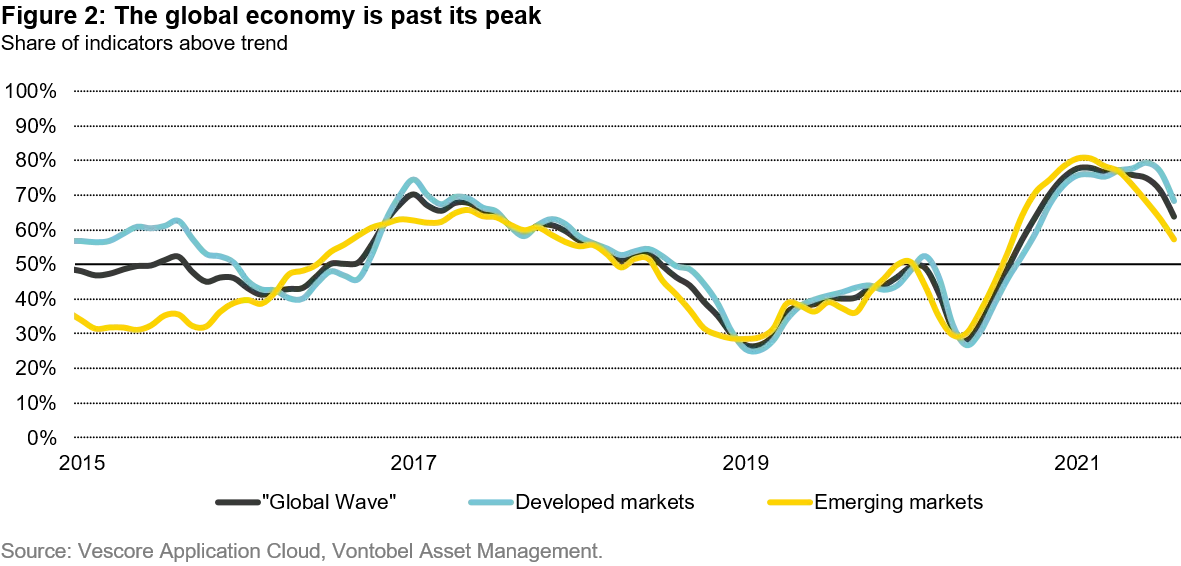
After an impressive economic expansion phase resulting in double-digit growth rates in many emerging and even developed-market economies in the first half of 2021, the Wave model started to signal fading economic momentum. Across the 50 markets covered, the first one to exhibit slowdown signals was the Chinese economy in February 2021, which, sure enough, has since been a drag for Asia as a whole (see figure 2). However, it’s worth noting that China and other Asian countries, due to their efficient handling of the pandemic crisis, had staged a much faster recovery than other regions. The strong global demand for technology goods produced in China, Taiwan, or South Korea during the pandemic crisis was another reason for the previous strong showing of Asian economies. Therefore, the current slowdown in that region can also be interpreted favorably as a natural cooling-off period.
As China led the 2020 global economic recovery, it was already in the position to normalize monetary policy last year and focus on longer-term policy goals such as the deleveraging of the Chinese economy and the quality of growth. Both the fiscal and the monetary policy impulses have since slowed, dragging down our Wave model. While China started its policy normalization process from a position of strength, several other emerging economies, particularly in Latin America and Eastern Europe, were indirectly forced to tighten monetary policy.
The sudden rise of US yields in the spring of this year, driven by higher US inflation expectations and concerns about a less generous stance of the US Federal Reserve, was a reminder of the so-called taper tantrum in 2013. At that time, the Fed’s mere hinting at a tighter monetary policy caused Treasury yields to spike, which depressed financial markets particularly in emerging economies. Fortunately, the fundamentals of most of these countries look much better today. Even so, more vulnerable debt markets in Latin America have been hit hard, due to their historical low advantage of interest rates relative to the US. To stabilize their currencies, central banks in countries like Brazil were among the early movers on policy tightening six months ago. What they gained in terms of financial solidity and monetary flexibility is about to be offset today by a slowly fading growth momentum.
Thanks to the decisive steps of the pandemic crisis, Asia led the global recovery in 2020. But lately, industrialized countries have established themselves as economic leaders due to successful vaccination campaigns. With emerging-market peak growth clearly behind us, we may just about have passed the peak in developed economies (see figure 2). Our Wave model confirms this: In August, slightly more than half of the 50 countries covered witnessed a deceleration but they represent 90 percent of global GDP.
At this point, it is worth noting that the slowdown in China, for example, isn’t interfering with the country’s expected strong growth in 2021 real GDP, which we peg at 8.2 percent. That said, the fading momentum will be felt at a later stage, which is why we expect growth in China to slow to around 6 percent next year.
Although our Wave model is designed to anticipate the most likely business cycle state in the near future, it can also inform the “transitory versus permanent” inflation debate. Leaving aside the phenomenon of price-distorting base effects, we are observing fundamental signals that inflation is rather short-lived. A closer look at the Wave indicators reveals that most of the 150 processed labor-market metrics we track have yet to reach levels equaling full employment. Such a case would pose a much higher risk of inflationary pressure via wage growth.
The bank lending channel doesn’t point to high inflation pressure either. Much of the money central banks created since the global financial crisis has ended up in financial markets, not reaching the real economy in the form of loans, for example. Moreover, one year after the pandemic crisis, saving rates are still well above pre-Covid levels in many countries, which dampens the consumer recovery to some extent. However, our Wave model suggests that inflation is unlikely to fall back to 2019 levels this year and next due to persistent supply-side issues like container and semiconductor shortages. In addition, the slowly tightening labor market may translate into wage growth at a later stage. Upside risks for inflation are of a more structural nature such as the consideration of sustainability linked aspects, like carbon taxes, in production processes.
With our Wave model indicating a global downturn, the obvious question is what this means for asset prices. Our analysis of 13 economic slowdowns since the early 1990s shows that cyclical asset classes like equities (see figure 1) or commodities tend to perform well in such an environment, with a pronounced effect in the aftermath of the global financial crisis in 2007/08. The main explanation for this is that since 2009, monetary and recently even fiscal policies have been looser for longer and tightening cycles less pronounced.
However, we have to dampen investor’s return expectations a little bit. Our analysis also shows that returns tend to be smaller in the slowdown than in the recovery and expansion phases. Stellar double-digit growth rates in many emerging and even developed market economies in the first half of 2021 have hidden the fact that many economies have lost economic momentum, which is more relevant for investors looking to stay ahead of the market. Volatility tends to be higher in an economic downturn, which requires a more active and opportunistic investment approach with setbacks offering buying opportunities.
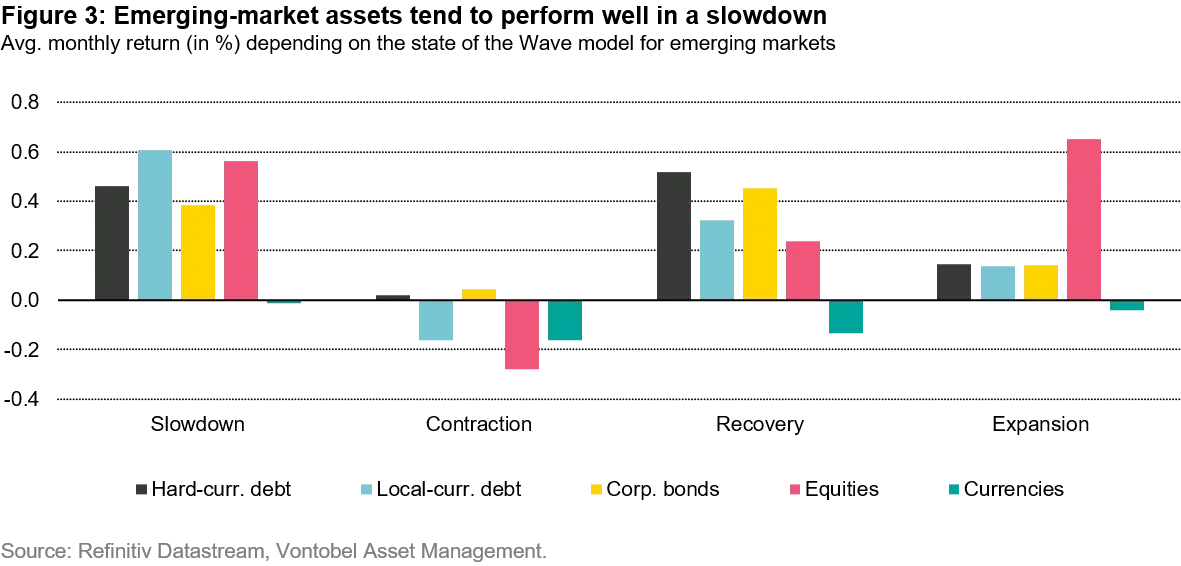
A deep dive into emerging market asset classes reveals that all of them have performed well during previous slowdowns, with equities delivering the highest return (see figure 3), which seems surprising at first sight.2 This has mainly to do with two facts: First, extremely strong growth rates in the 2000s due to the commodity bull market and accelerating globalization – China joined the World Trade Organization in December 2001 – which had a beneficial effect on global trade and equity returns. In the 2010s, fading growth rates were compensated by an extremely loose global monetary policy stance lifting almost all boats. Second, the performance of emerging-market equities remains highly correlated to commodity prices. As commodities are a late-cycle asset class, they tend to perform strongly in the slowdown, with emerging economies as the major beneficiary.
Hard-currency debt, local-currency debt, and corporate debt, also boast strong track records in the slowdown as global yields tend to have passed their peak, thus allowing for capital gains of bonds. Emerging-market currencies have witnessed selling pressure since 2010 as the respective economies gave up ground and investors turned away from formerly much appreciated countries such as Brazil. Moreover, higher inflation in emerging markets weighs on currencies, as it is a sign of a decline in competitiveness relative to developed markets.
 Past performance is not indicative of future results.
To conclude, the world has seen a peak in growth and will probably see a peak in inflation soon. Passing an economic peak isn’t as negative as it sounds, because returns tend to be still positive albeit lower than in the economic upturn. Volatility is on the rise as we are approaching policy normalization in the US, which suggest a more active and opportunistic investment approach. Since we have barely scratched the surface of the insights that the Wave model provides, we look forward to sharing our views on the winners and losers we expect in our next update.
1. See Vontobel article “The Vescore Wave – a superior business-cycle model”
2. We shortened the sample in this analysis to 2002 until June 2021 to make emerging-market asset class performance comparable, as the reference index for local debt is available only since December 2002.