Lessons from shale oil – clean data is critical for ESG
Quality Growth Boutique
Why did so many well educated and well meaning people not take the plastic tsunami seriously until an island of the stuff became headline news?
Statistics and comments from environmentalists were both available. But the penny didn’t drop for many because data points and a flow of warnings from the same voices didn’t connect to wake people up. This failure to connect has its roots in signaling theory, which was introduced by Charles Darwin in his 1859 book ‘On the Origin of Species’. Darwin identified that for a signal from one animal to another to be effective, not only must it imply ability, but it also needs to be authentic.
The delivery of authentic messages has rarely been as important as it is now. The earth’s 7.7 billion population is set to reach 10.9 billion by the end of the century according to the United Nations. This demographic growth accompanied by broad economic development is colliding with environment damage and global climate change. The lack of clean and comparable data is a challenge investors face as they unfurl the wealth of knowledge under the ESG umbrella. Insights will influence capital allocation decisions capable of shaping economic development in the future.
But as Mark Twain stated in his excellent description of ignorance: ‘It’s not what you don’t know that gets you into trouble, it’s what you know for sure that just ain’t so”. Relying on inaccurate or incompatible data can result in accumulating real world problems, not to mention poor investment choices. As we have discovered over the years, it is hard to identify problems you cannot measure, let alone make changes.
So, how do we get companies to produce consistent and accurate measures on issues they may not be keen to share. Ultimately, rules and audited disclosures make sense, as they do with financial reports. But global agreements are torturous and slow. What practical steps can investors take in the meanwhile?
Third-party verification
An example we think illustrates the point is from the gas emissions data self-reported by U.S. shale oil producers. These appear to have transitioned from poor to decent without any new rules. The catalyst was the 2011 launch of a satellite operated by NASA and the National Oceanic and Atmospheric Administration (NOAA) that records daily measurements of flaring activity.
Shale oil - and its inconvenient friend, methane
Oil extracted from shale has led the US to become the world’s largest oil producer. The Energy Information Administration (EIA) estimates in 2018 that some 59% of US crude was from shale. This growth has also given the US the dubious honor of being the fourth largest flarer of gas by volume in 2018 (World Bank) - behind Russia, Iraq and Iran. This is a serious problem as methane and carbon dioxide are the most prevalent greenhouse gases (GHG) contributing to climate change.
When companies drill primarily for gas, they take care not to waste it. But when they drill for oil, the accompanying gas (known as associated gas) is often a small byproduct – the money is in the oil. As oil production has grown, so has the supply of gas.

For oil drillers there are three basic choices of what to do with associated gas:
1) Sell - pay to pipe it to a buyer
2) Vent – release natural gas (methane) into the atmosphere
3) Flare – burn the natural gas and release the resulting carbon dioxide into the atmosphere
A company may choose to dump the gas into the atmosphere as carbon dioxide or methane rather than sell it if there are no pipes close by to transport the gas, or if the price they would sell it at is less than the cost of piping it to the buyer. Burning natural gas converts methane to carbon dioxide, a less impactful GHG (Jump to Quiz – which is worse for global warming – carbon dioxide (CO2) or methane (CH4)? see quiz at the end for which is worse).
Measuring and numbers
Using third party observations gives us the ability to cross-check company figures. Since its launch in 2011, the NOAA satellite (Suomi NPP) has collected daily measurements of flares using what is known as its Visible Infrared Imaging Radiometer Suite. These observations of gas flares are then calculated into volume estimates.
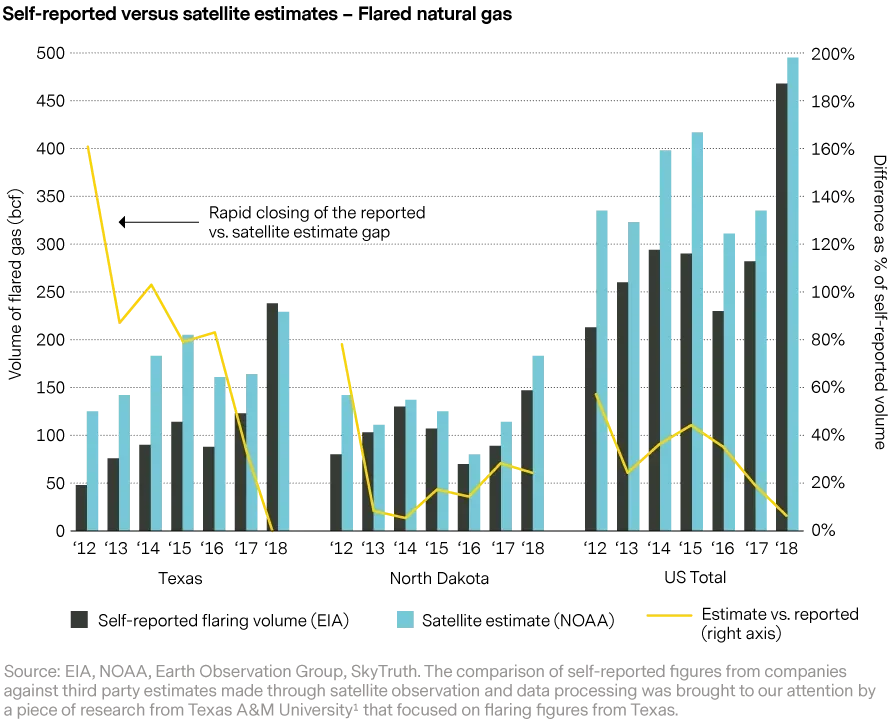
Measuring flared gas volumes from a satellite is not an exact science, given the need to adjust for weather conditions that can affect flame shape, size and color intensity. However, it is interesting to note that not only has the direction of the estimated emissions moved consistently with the self-reported figures – but that the self-reported figures have also risen rapidly to track the estimates.
The chart below shows self-reported EIA data against the NOAA estimates. They are slightly different measures – the EIA data includes both flared and vented volumes, while NOAA just covers flared volumes. So, all else equal the EIA figures should be higher than NOAA figures. The yellow line represents the difference between the two as a percentage of the EIA volume. North Dakota (Bakken formation) and Texas (Permian basin and Eagle Ford) are states reporting the highest flared and vented gas volumes.

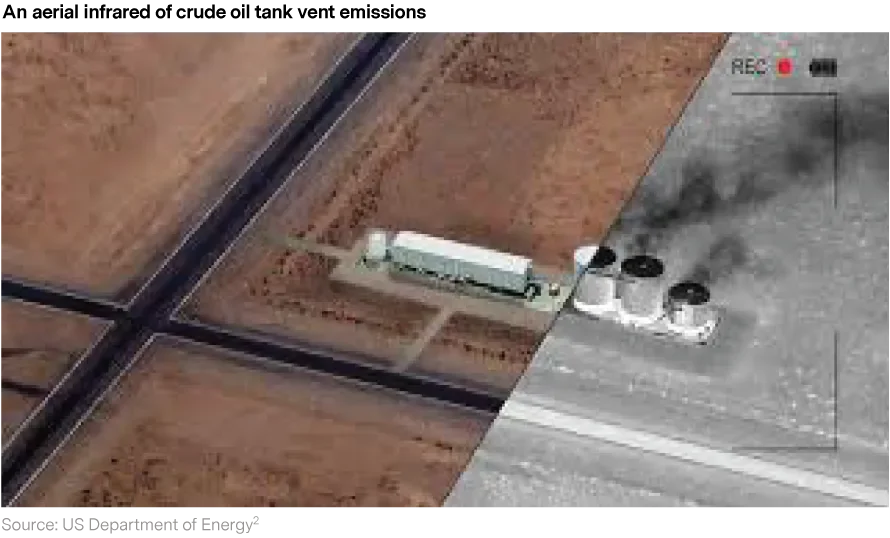
Satellite has produced a remarkably effective way of capturing many data points with geographic accuracy over short periods of time. However, there are various ways to measure emissions that do not require such a sophisticated set up, although they are less powerful. Below is an example of methane imagery taken from a helicopter. Methane cannot be seen by the naked eye, but can be captured by infrared camera.

Natural gas as a step fuel – proceed with caution
While natural gas is a fossil fuel and both methane and carbon dioxide are greenhouse gases, it can be a step in the right direction as economies (ideally) move away from coal towards a renewables future. Not only does natural gas produce fewer particulates that are bad for health than coal3, it also releases fewer GHGs when used to produce electricity.
However if the process leaks gas into the atmosphere, GAS CAN BE WORSE THAN COAL!
Coal does not leak vented, but gas can. If just 4% of the methane used to generate electricity leaks, or is vented, between the ground and turbine, it would actually result in gas having a worse impact on global warming than coal over a 20 year period.
These observations show us that the amount of gas emitted was probably greater than previously reported. As a result, the benefit from switching to gas-powered turbines overall was less than it could have been. Not due to the turbines themselves, but due to the volume of overall emissions derived from the oil producers. To avoid leakage or flaring, more affordable piping capacity needs to be made available to carry gas to the market. More importantly, a decision by managements or governments to minimize, or not vent at all, would help reduce the total climate impact of oil.
Investors as owners
For investors, independent data that is consistent and verified can bring significant value in understanding their exposures. This is important to help understand the real world impact companies are creating, which may be difficult to observe as investors. It can provide an idea of the potential magnitude of risks (or opportunities) a company is facing from changes in regulations, taxation, or consumer choices.
In the long-run, we anticipate that third party verification will become mandatory for many environmental and social data sets. To us, it seems likely and sensible that companies (shareholders) will eventually pay for the third party verification, in the way they currently do for auditing or credit ratings – a single purchase can provide value to a broad range of stakeholders.
We believe third party verification can provide a watchful eye to keep both businesses honest, while encouraging industries to follow consistent standards. More well-grounded trust in the fundamentals is good for all stakeholders.
Quiz – which is worse for global warming – carbon dioxide (CO2) or methane (CH4)?
Methane – although it depends. The time period used to measure the impact makes a difference. Methane is a gas that absorbs heat well, but only lasts in the atmosphere around 10 years. Carbon dioxide does not absorb as much heat, but lasts an estimated 1,000 years. Measurements usually use the Global Warming Potential (GWP) which is given as a measure relative to the impact of carbon dioxide. Over a 20-year period (with methane active the first 10 years) the GWP of methane is estimated to be 84-87x more impactful than carbon dioxide (according to Environmental Protection Agency (EPA) estimates). However over a 100 year period (which is more typically used, but has less headline value) methane’s GWP is lower at 28-36x (EPA). The GWP falls as the carbon dioxide is around the full period, while methane only the first decade.
1 Flaring in two Texas shale areas: Comparison of bottom-up with top-down volume estimates for 2012 to 2015. Authored by Katherine Willyard and Gunnar Schade published January 2019.
2 Natural gas flaring and venting: state and federal regulatory overview, trends, and impacts June 2019
3 Beyond Global Warming Potential, Farquharson, Jaramillo, Schivley, Klima, Carlson, Samaras, 2016 Yale University – summary:
https://onlinelibrary.wiley.com/doi/abs/10.1111/jiec.12475
. Comparing natural gas combined cycle plants against pulverized coal plants, both without carbon capture and sequestration equipment.


